Price maps
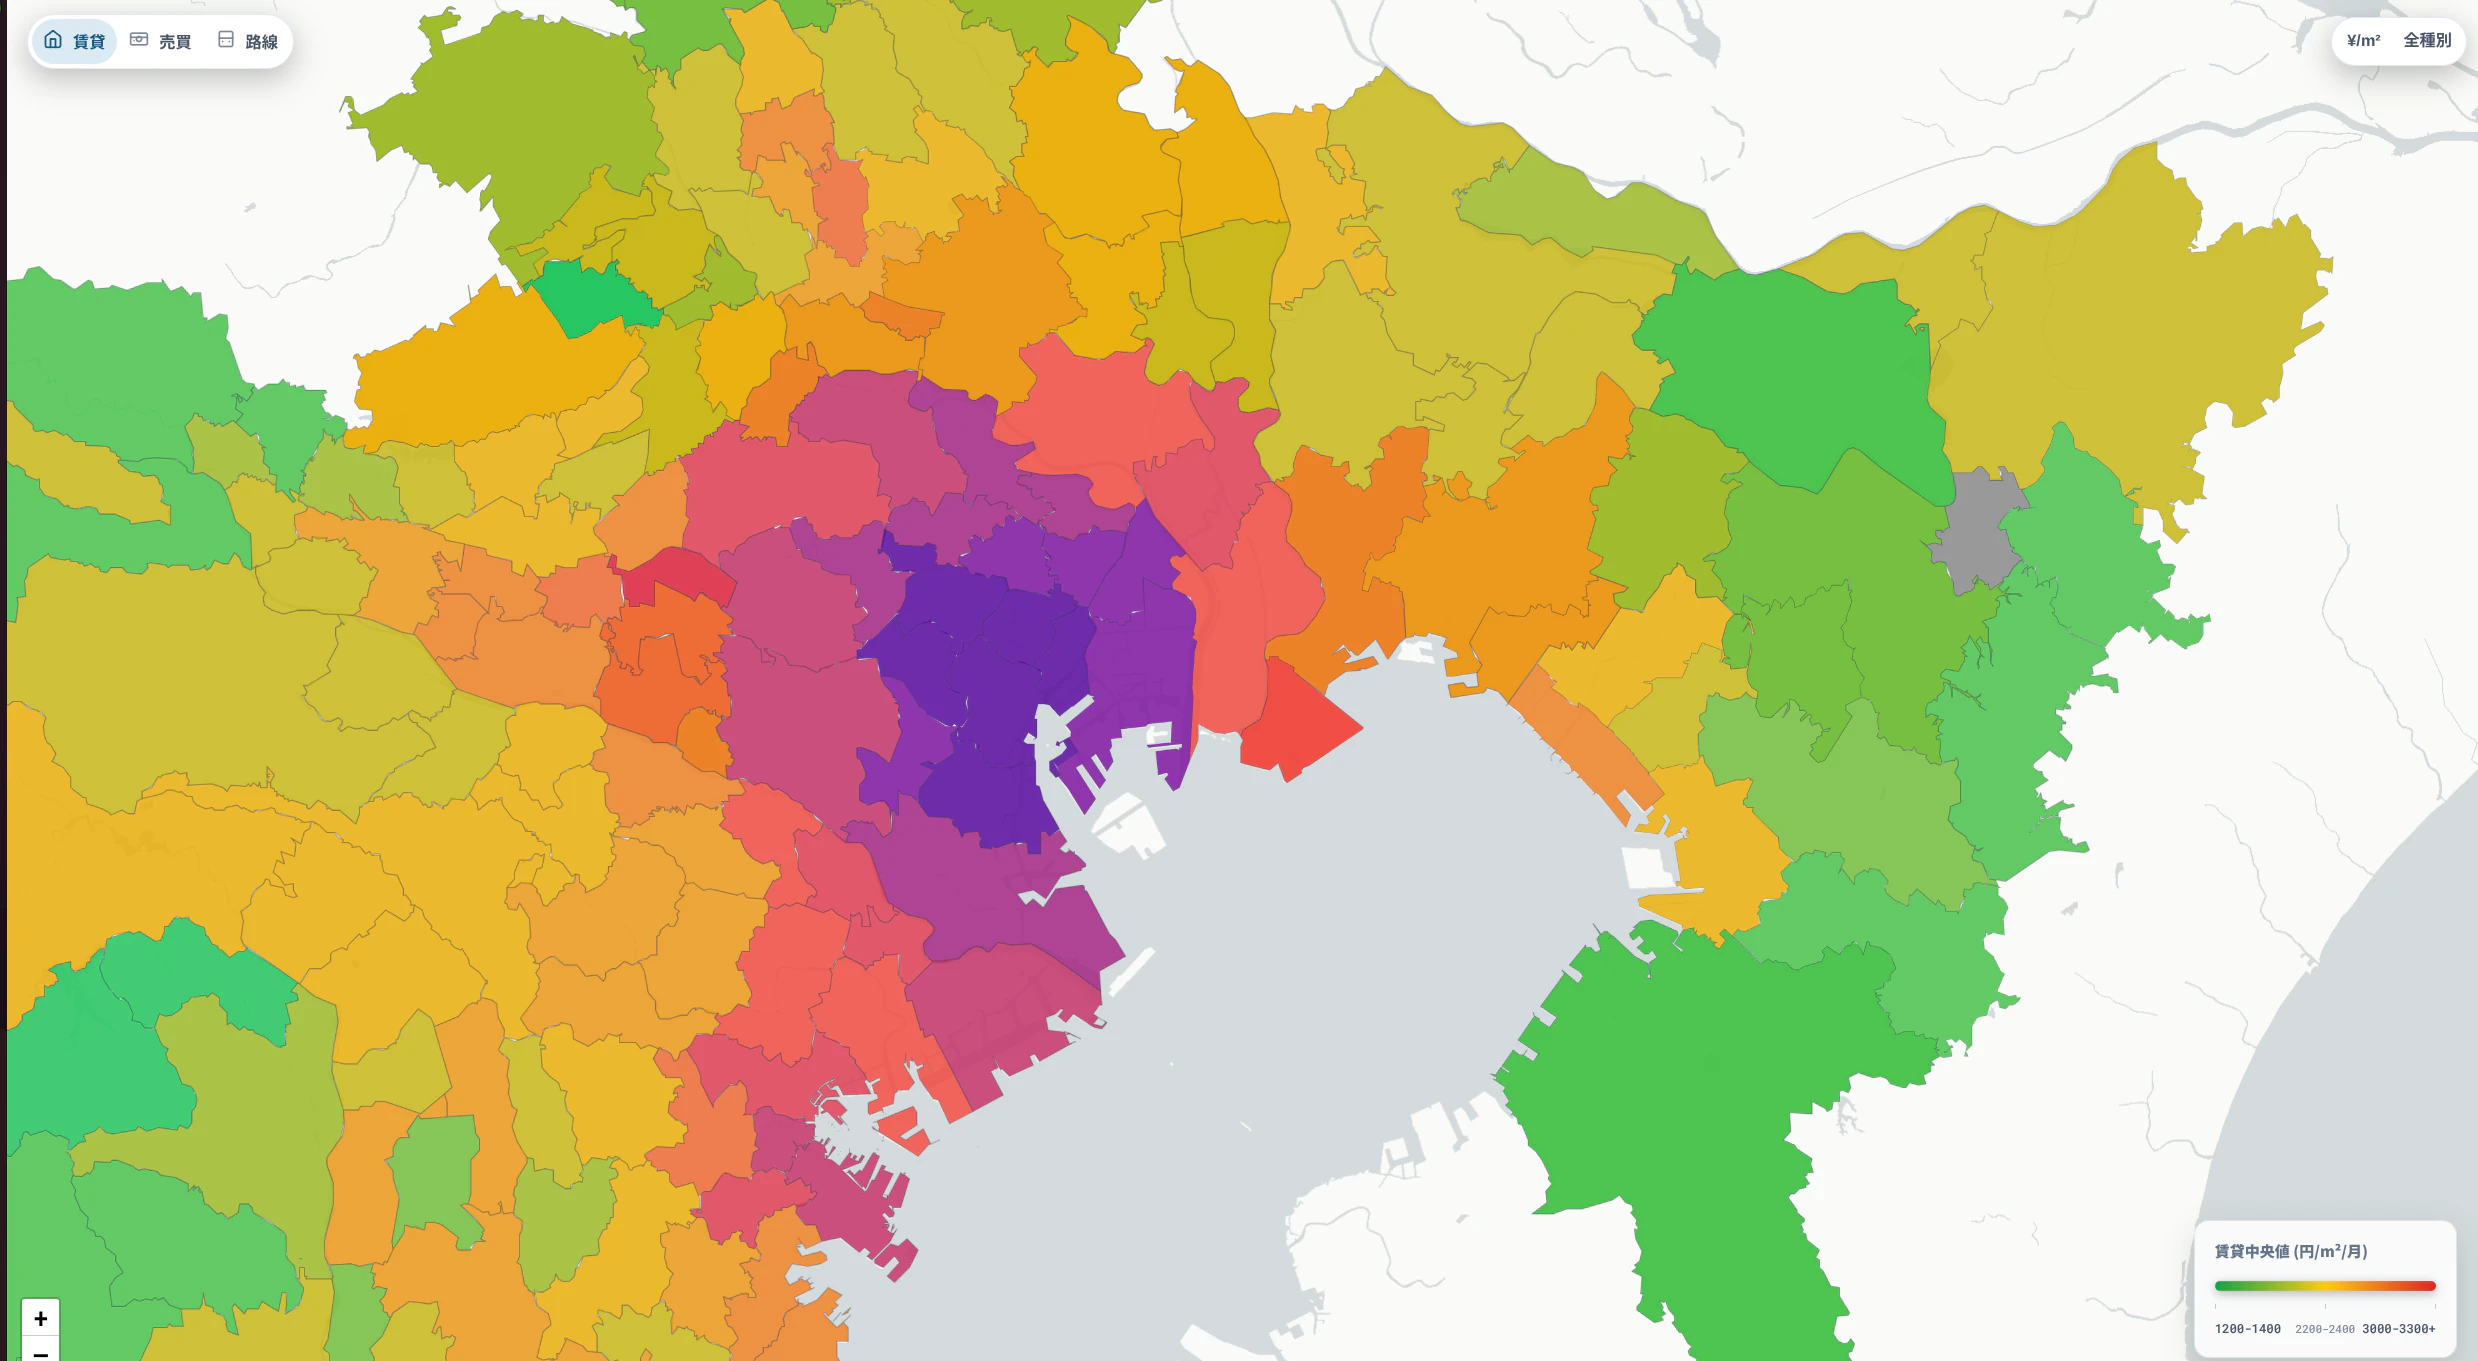
Compare rent and purchase levels by ward, town, and rail-line catchment.
Open the mapArea research for home seekers and investors
Fudosan Soba helps you compare where to live or invest in Japan. Use the free map to check rent, purchase prices, commutes, and neighbourhood quality. For investment research, you can also compare yields, listing activity, sales activity, and price differences.
Products
Explore area prices, search by commute, check a specific property, or study the wider market. Each tool answers a clear question.
Compare rent and purchase levels by ward, town, and rail-line catchment.
Open the mapRank neighbourhoods by workplace access, budget, layout, and local quality.
Find commute areasCheck rent, price, yield, and buy-vs-rent decisions on the same data base.
Open property toolsSee how prices change by building age, floor plan, and ward.
View the analysisWhy different
Most market data sites hide the first view behind a report or a contract. We show the maps, the method, and the caveats first, so you can judge what you are looking at before you go deeper.
Look closer
Compare prices and local quality by town, ward, rail line, and neighbourhood instead of relying on broad city averages.
See change
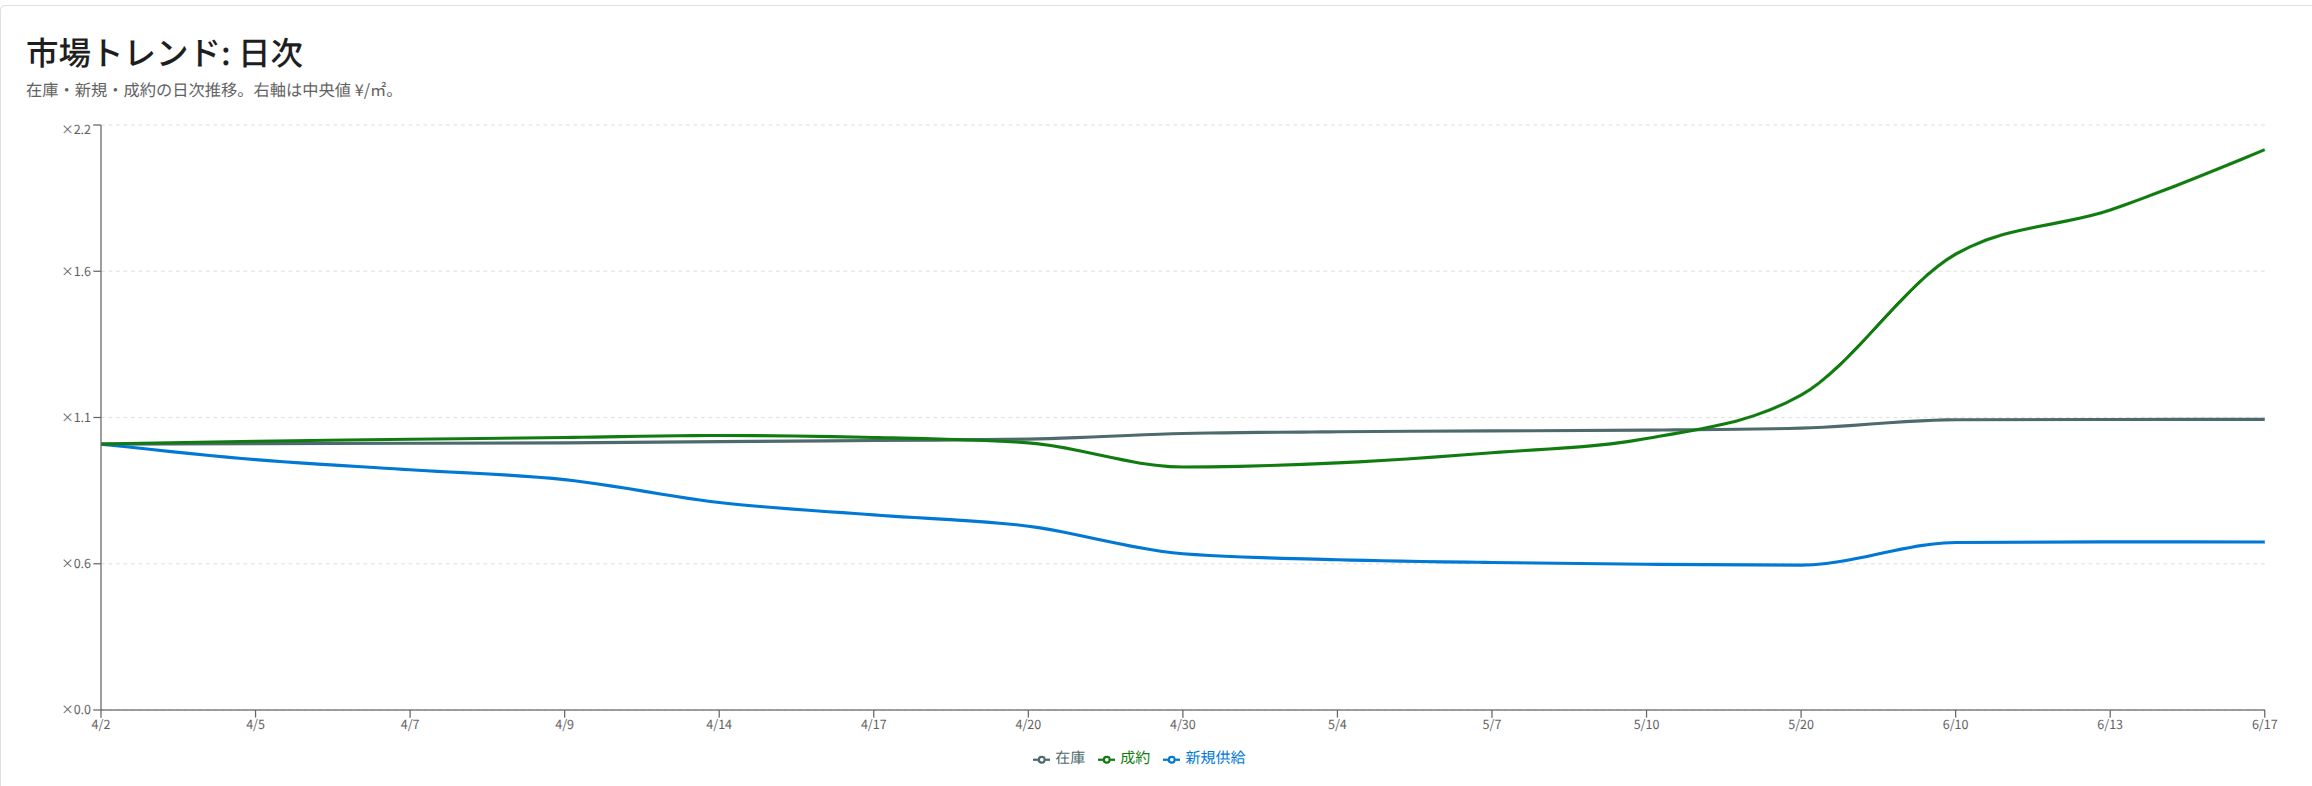
Track active listings, properties that may have sold, new listings, and price cuts each day.
See the area
See which shops are nearby and how customer interest is changing, alongside local property prices.
Go deeper
The detailed analysis tools bring together price differences, listing and sales activity, nearby shops, and estimated investment returns.
Who it helps
Living, investing, building, or explaining a market. Start with the same public map, then open the tools that fit your goal.
Check commute, budget, rent fairness, and area fit.
Commute finderCompare yields, listing activity, sales activity, and local price differences.
Find investment areasUse rent, land prices, and local demand to decide whether a project makes sense.
View detailed analysisExplain neighbourhood strengths, price tiers, and Places momentum.
Use casesExplore the market in your browser first. Open the detailed analysis tools when you need more information.