PUBLIC MAP / PRODUCT GUIDE
Seven ways
to search a city.
From rent and sale prices to layout, budget, rail lines, workplaces, and reachability. Read the same city again through the constraint that matters now.
ONE CITY / DIFFERENT QUESTIONS
One map does not mean
there is only one answer.
This is more than a map for looking at averages. Read the market, apply your constraints, or work backward from movement through the city. Each product changes what the city reveals.
01 / READ THE MARKET
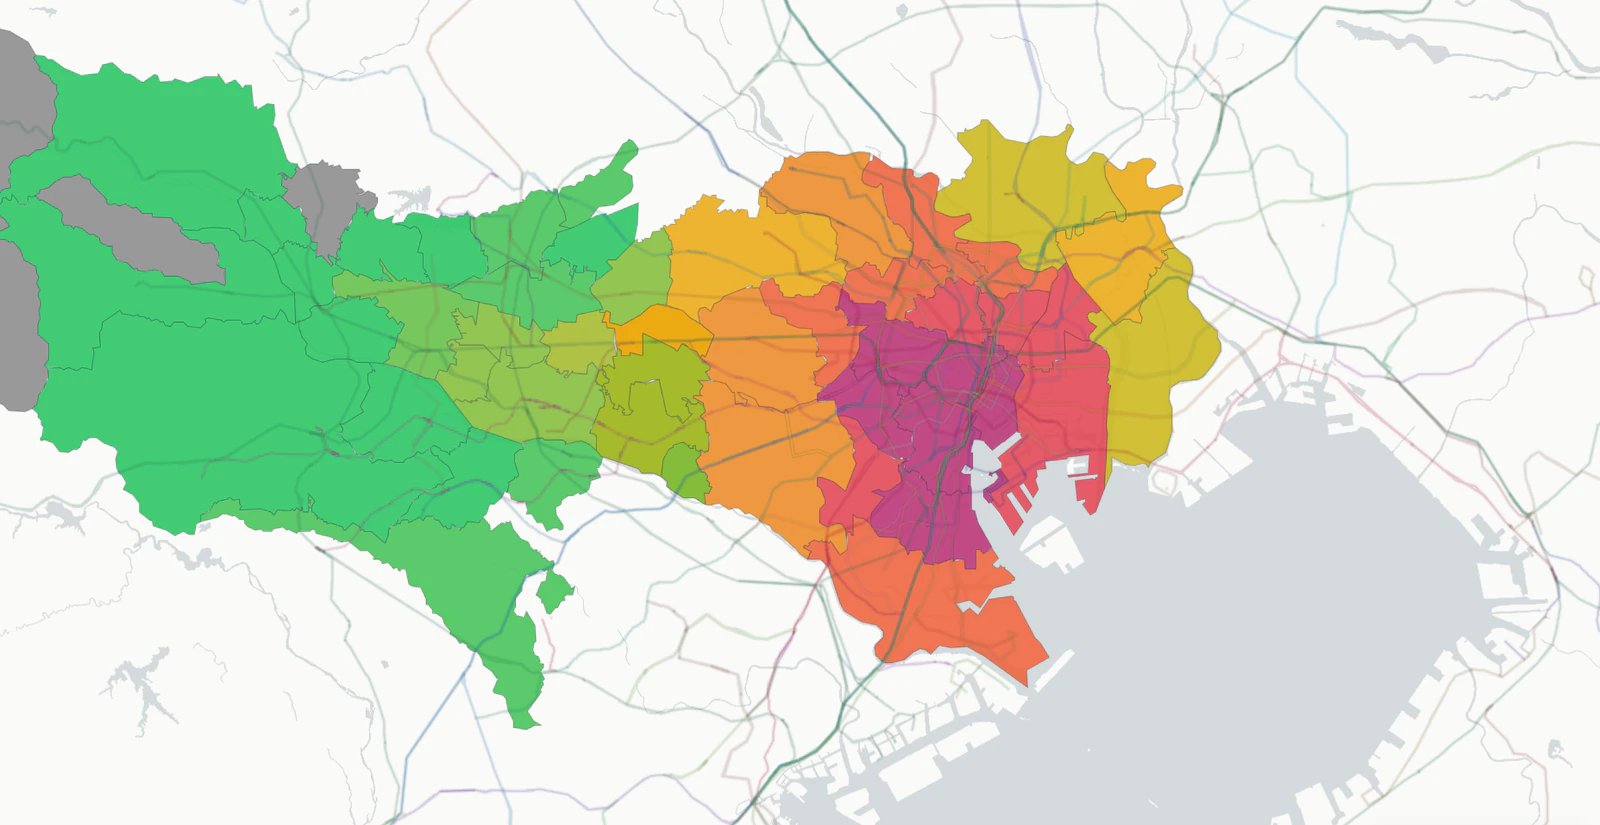
First, read the terrain of price.
Compare neighbourhoods at the same scale and in the same units. Switch between rent and purchase prices, then isolate the layout you need to reveal differences hidden by citywide averages.
02 / APPLY A CONSTRAINT
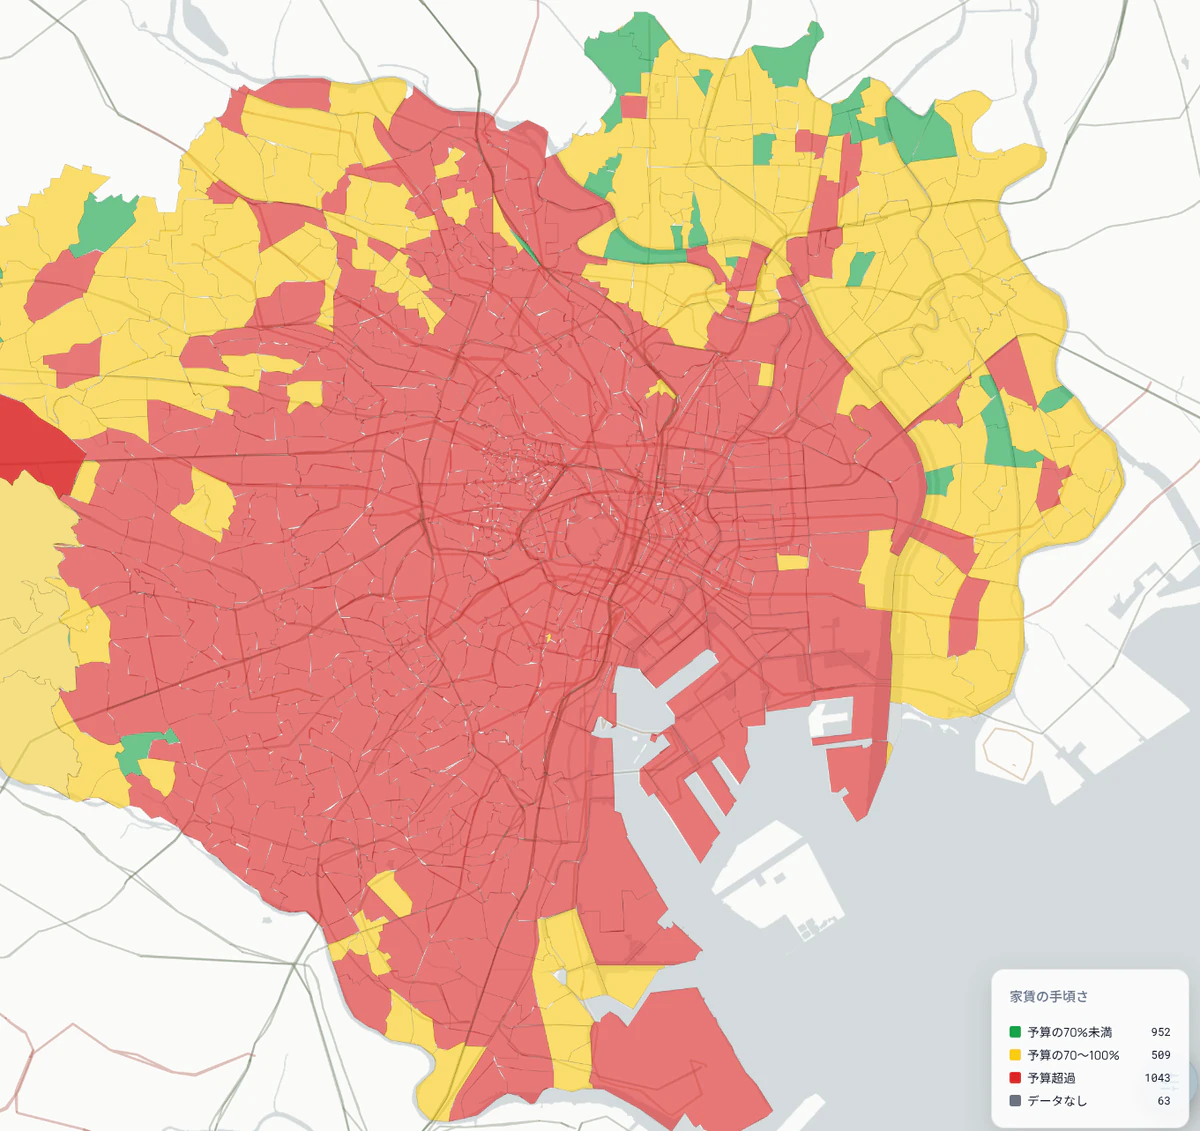
Then redraw the city around your limits.
Move from “what does it cost?” to “where can this budget work?” Enter a monthly ceiling and a layout to separate viable neighbourhoods from difficult ones on the same map.
03 / MOVE THROUGH THE CITY
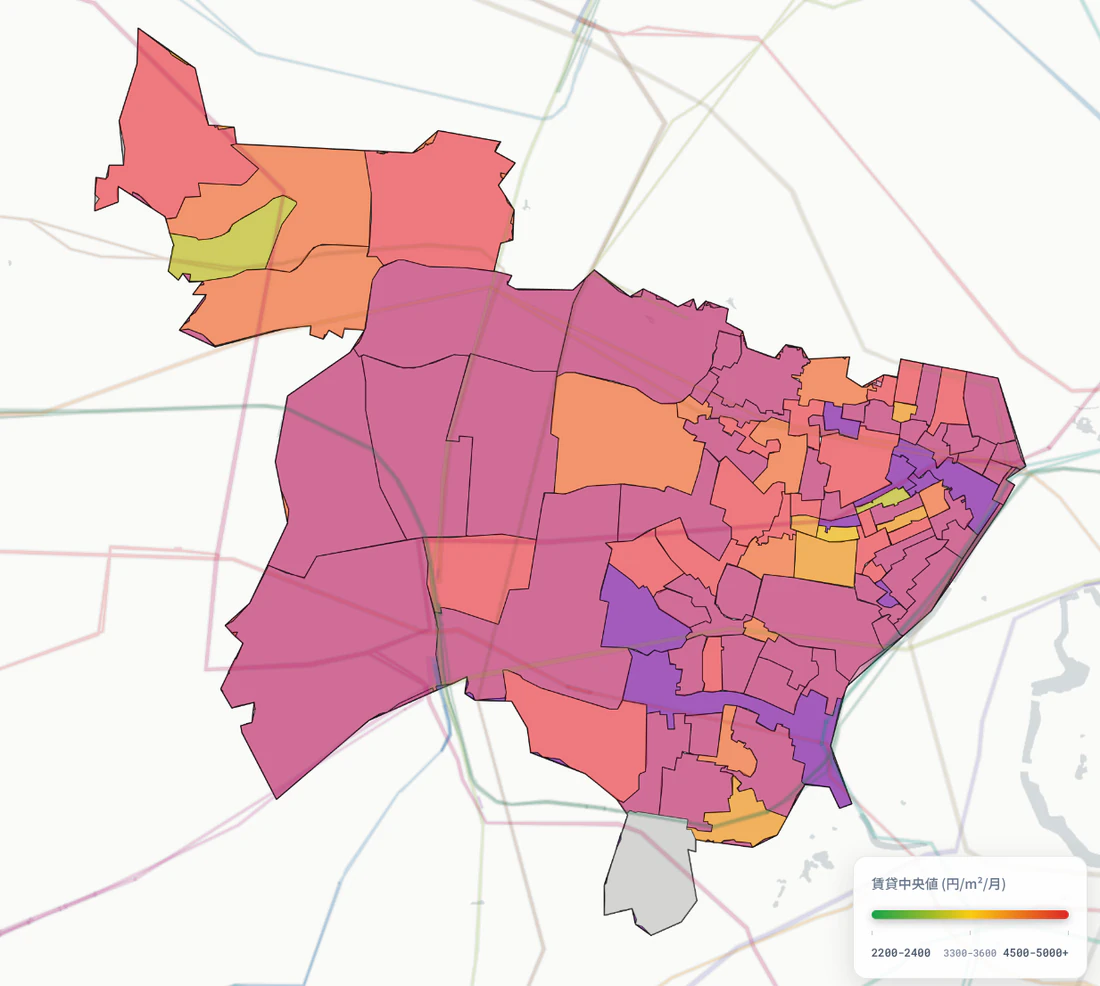
Finally, turn distance into time.
Straight-line distance does not decide where life works. Treat prices along a rail line, access to multiple workplaces, and the area reachable from one origin as three different questions.
ALL PRODUCTS
Seven entrances.
Start with the question you have.
Where does rent change?
Neighbourhood rent bandsOpen ↗ 02BuyDoes the sale-price map match rent?
Purchase price and unit priceOpen ↗ 03LayoutsDoes a larger home reorder the city?
Distribution by layoutOpen ↗ 04BudgetWhere can this monthly limit work?
Neighbourhoods within budgetOpen ↗ 05RailWhat is one more stop worth?
Rent by station and time valueOpen ↗ 06Live near workWhich town works for several offices?
Ranked towns matching constraintsOpen ↗ 07ReachabilityWhat is within 45 minutes from here?
Towns reached by walking and railOpen ↗22 CITIES / PUBLIC ACCESS