What rent costs,street by street.
23 wards across Tokyo, compiled daily from advertised listings. The darker the shade, the more a square metre costs.
- 22 cities Across Japan
- 939 areas Inside Tokyo's 23 wards
- 9 cities With a monthly report
- 94.9 % Of last month's revisions were cuts
22 cities, measured the same way
The same method, extended across Japan's major cities. Last month's move is shown for the cities we report on.
| City | Areas | Listings | Rent ¥/m² | Sale | Rent |
|---|---|---|---|---|---|
| Osaka | 24 | 18,307 | 2,900 | -0.85% | |
| Tokyo | 23 | 169,989 | 4,299 | -1.58% | -1.3% |
| Yokohama | 18 | 22,571 | 3,265 | -0.83% | -0.55% |
| Nagoya | 16 | 34,254 | 2,206 | -0.73% | |
| Kyoto | 11 | 43,905 | 2,136 | -0.58% | |
| Sapporo | 10 | 23,206 | 1,511 | -0.88% | -0.26% |
| Kobe | 8 | 25,241 | 2,128 | -0.99% | |
| Kawasaki | 7 | 15,458 | 3,241 | -0.94% | -0.32% |
| Fukuoka | 7 | 24,324 | 2,359 | -0.66% | -0.33% |
Listings and rent are this month's count; sale and rent moves are the change on last month
Also covered
Read the reports The map and the table are linked
What this map answers
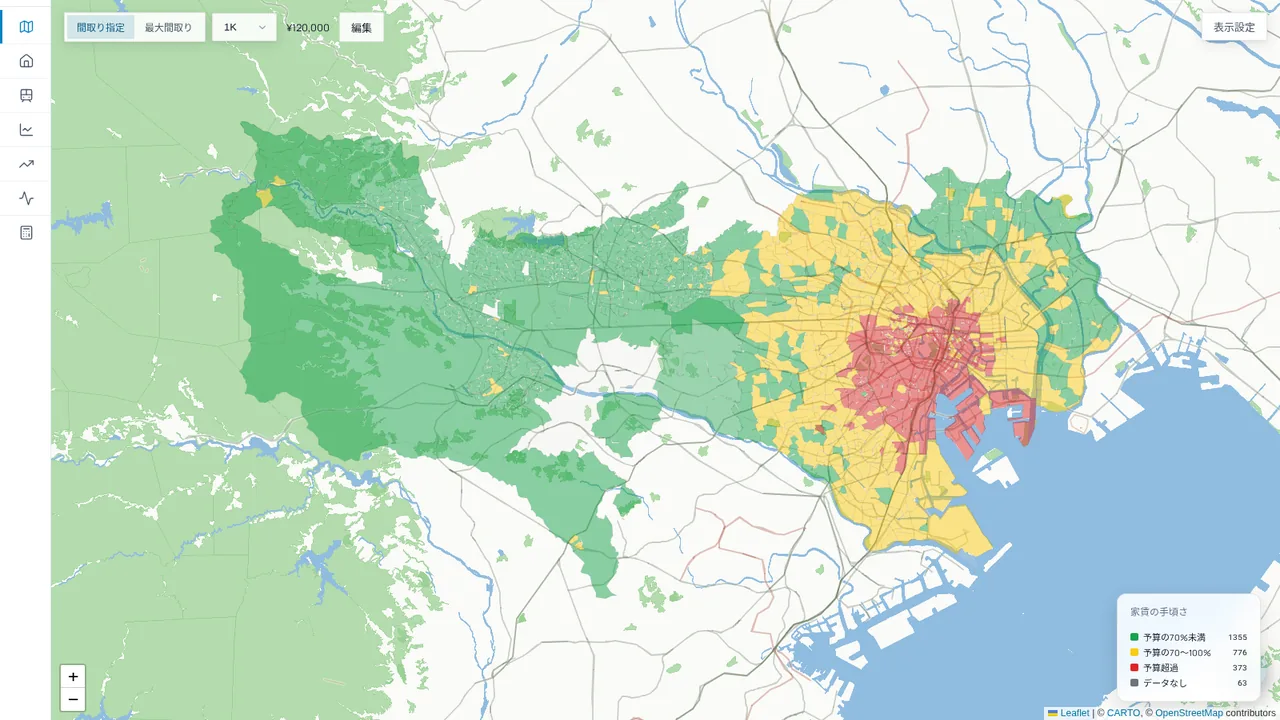
- Where does my budget reach Set a ceiling and a layout: neighbourhoods inside it turn green, the rest turn red.
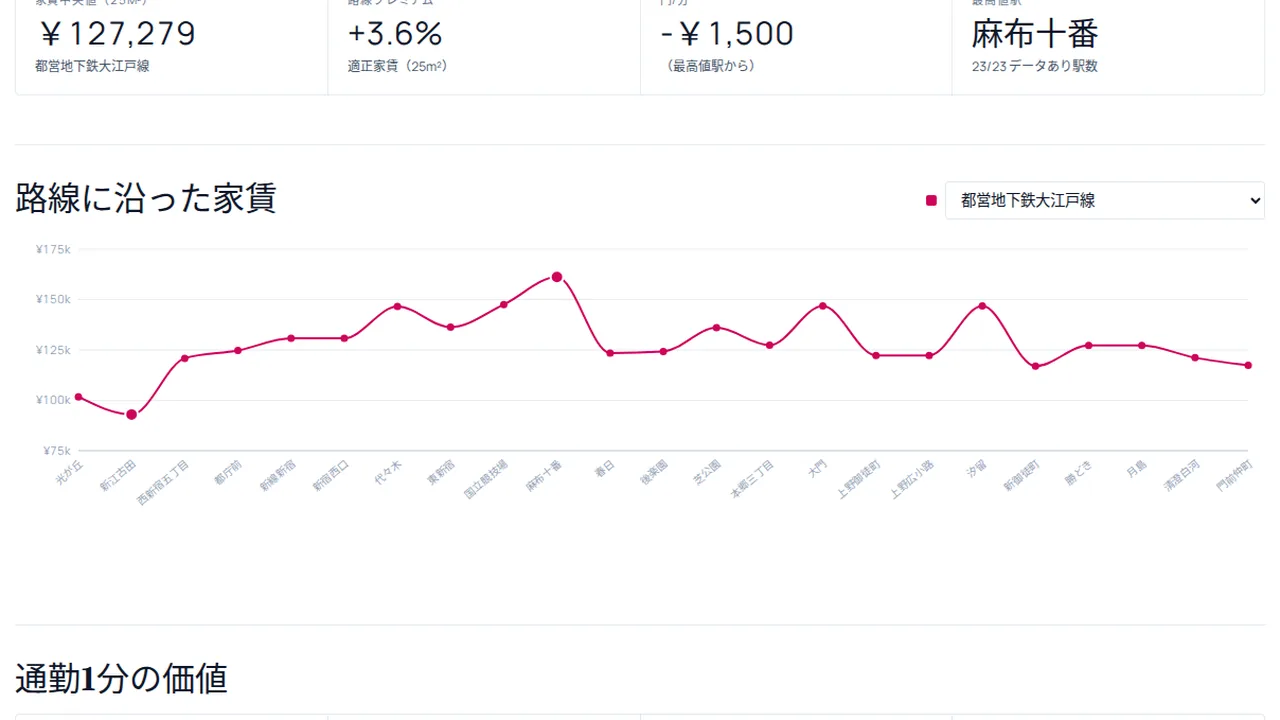
- What does one stop save Rent along every station on a line, down to what one minute of commuting is worth.
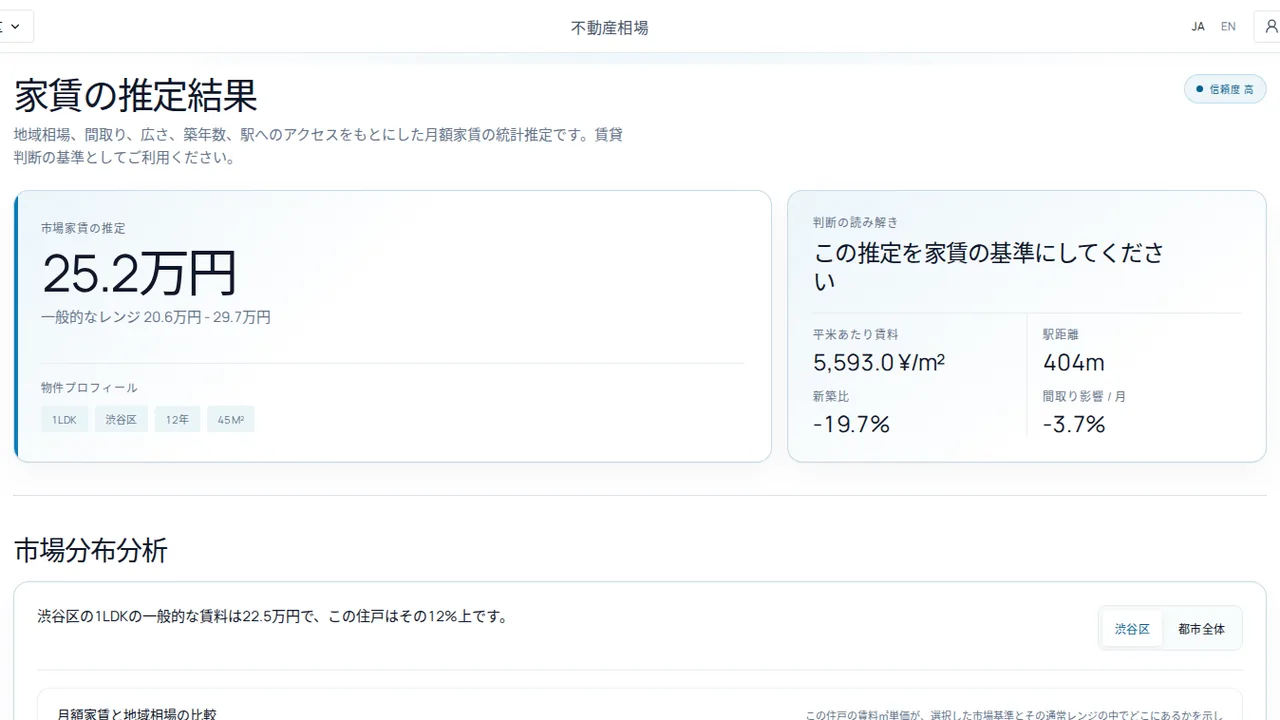
- Is this listing overpriced Placed against listings matched on size, building age and area.
Looking at it as an investment
Yield, price structure, supply, and how an area is changing, compared at ward and neighbourhood level. Some of it opens without an account.
- Preview free Price against age Price per m² by age band, split by ward and layout. Available in 14 cities Open
- Preview free Yield and payback From rent and price in the same area. Built from 377,255 listings Open
- Subscription Area screening Rank by yield, price, supply, and how an area is changing. Compares 193 areas nationwide Open
- Subscription Build against buy The same capital committed either way. Run on 9 cities of monthly data Open
How the figures are built
A monthly median over whatever happens to be advertised cannot separate a change in price from a change in the mix of what is on the market, so we match each listing against its own previous price. Listings that sell disappear, so what remains leans toward stock that did not move. Where a month has too few observations, we publish nothing for it.